This blog has moved to my new personal website and from now on can be found here: http://lexnederbragt.com/blog/.
No new posts will be added from now on, but old posts will stay up.

This blog has moved to my new personal website and from now on can be found here: http://lexnederbragt.com/blog/.
No new posts will be added from now on, but old posts will stay up.
Earlier this year, I wrote a post about the new first-semester bachelor course “Introduction to Computational Modelling for the Biosciences” at our institute. A quick summary:
Yesterday, I finished grading the exam, so it is about time for a recap: how did it go?
There were 200 students present at the first of the weekly lectures.

Me lecturing for 200 students for the first time
Each week, they would have a four-hour datalab session in the new ‘bring-your-own-device’ teaching room, where 60 students would sit in groups of 6 at hexagonal tables, with for each table a big screen available that any student could connect to from their laptop (all screens could project what was shown on the central screen, or on any of the other screens, really fantastic).

Teaching room with hexagonal tables and a big screen for each table
A typical datalab would start with formative assessment in the form of multiple choice questions (see ‘Peer instruction through quizzes’ in this blog post). This was often followed by ‘Computer Science Unplugged‘-type activities, pen-and-paper exercises to introduce programming concepts. Then they would work on programming exercises.
The programming environment we used was Jupyter Notebooks, accessed through a JupyterHub instance built for this and similar courses at the university. Exercises, and solutions the following week, were handed out as notebooks. Students were supposed to deliver one assignment, as a notebook, each week. I’m quite proud of the fact that we were able to deliver the course book chapters not only as PDF files, but also as Jupyter Notebooks, with runnable code (the notebooks were stripped of code output, and students were suggested to ‘run’ the notebook interactively while studying it). More on that another time…
The figure below gives a broad overview of the structure of the book, a structure that was followed during the course. The philosophy for the book, and the course, was not teaching lots of Python first and then showing how it can be useful to solve biological problems, but introduce the biological problems first, and the Python concepts needed to solve them right after that. This way, all the learning of Python happened in the context of the Biology. The course book and materials will be published (Open Access!) in 2018.

Curriculum overview
In my previous post I identified a number of plans and challenges I had in advance of the first course edition, and I will comment on them here.
I wanted examples and exercises to be using data and questions that the students can relate to, given that they are studying biology/biosciences. This was implemented to a large extent, and I feel this worked quite well.
In preparation for the course, multiple ways were discussed to build a bridge with the Cell- and Molecular Biology course the students were taking the same semester. Students used Python to plot some of their laboratory measurements, calculated resolutions for different microscope lenses, digested the same DNA that they were going to digest using restriction enzymes in the molecular biology lab, in silico with Python. Students responded positive to having the exercises being relevant for their field of study, as well as seeing material used in both courses.
I am generally very happy with the choice of the Jupyter Notebook and the course room. There were no software installation issues and having a completely similar online environment (through JupyterHub) for all students, to which I could easily push new material, made organising the course much easier. There were some technical difficulties with the JupyterHub implementation – we were the first course to use it and ran into some unfortunate downtime, leading to understandable student frustration.
I had intended to use a ‘flipped classroom’ model, but did not manage to find a good way to make sure students had studied the relevant material from the book in advance.
I had 19 learning assistants, master student and PhD students. Recruiting them happened rather late, which prevented me from having more than one meeting with them to prepare them for the course. But they were an enthusiastic bunch, and worked hard with the students. Much of the learning that happened was thanks to them. I struggled to really built a community, not many showed up at the (voluntary) weekly meeting.
A big challenge with any (totally) new course is that much, or all, of the material needs to prepared for the first time. A lot of this work was done before the course started, but unfortunately, not many exercises were ready beforehand. This led to me spending most of my time during the semester preparing exercise notebooks. This situation had several drawbacks: students and assistants did not have access to next week’s exercise material until the first day it was going to be used in class. I could not spend much time interacting with the students during their datalabs. It was also quite stressful.
Around two-thirds into the course it became clear that a significant fraction of students felt they did not understand much, or anything, of the Python programming that was taught. The book was too difficult for them, many exercises too challenging, the format simply did not work for them. For the more mature students (that had studied elsewhere before) or those more or less familiar with programming, the format worked very well, but not for the rest. I’ll admit that this came as a bit of a shock, and I felt somewhat terrible about it for a while. In reflecting on his, I then posted this tweet, that I’ll explain here:
When I first thought about how to organise the teaching for this course, I strongly believed that the Software Carpentry approach of live-coding would be the best way to do it – it is after all how I do most of my teaching. With live-coding, an instructor or teacher does programming in real time and students in the room follow along, performing the same programming themselves – intermitted with many hands-on exercises. But at some point I started to worry live-coding wouldn’t scale to the 60 students present in the datalab, let alone the 200 students during lecture. Consequently, I dropped live-coding as a possible approach to teaching Python for this course.
When I discovered that many students were not learning the material, I decided to switch gears and go back to the live-coding approach. I announced that we were going to skip the material of the last two chapters of the book, and replace the remaining datalabs with repeat-teaching of the programming concepts. I did this through live-coding with the students, and also (finally) found a set of hands-on exercises that were very good for practicing more. The last three weeks of teaching were done in this way, and around 60-70 students came to these sessions. Feedback from the students was very positive: many were relieved and thankful, and felt they finally understood what this programming business was about. Interestingly, a handful of students were disappointed that the last part of the course material was skipped and asked whether they could still get access to it. In the words of the study-administration: “students never ask for more material, but for this course they did…!”.
In conclusion, I can only repeat “I thought the Software Carpentry live-coding approach wouldn’t scale to a large undergrad Python course and that I could do without it. I was 2x wrong”.
So how did the students do? 180 students were allowed to take the exam, and 169 did. 80 % passed the exam, with an average C grade (scale A-F). From looking through the results, I saw a lot of learning has happened – although quite some misunderstandings remained. I decided that these results are actually not too bad for a first edition, and I’m actually quite happy with them.
I was recently asked what the biggest changes are that I want to make for the next time the course is taught (fall semester of 2018). Here was my answer:
All in all, organising this course has been (one of) the biggest and demanding projects I have ever undertaken, but I don’t regret one second accepting the challenge. The current generation of students will meet big datasets and complex analysis and modelling (Machine Learning! Artificial Intelligence!) whatever they end up doing in their professional lives. I am very proud to be a part of a (larger) effort to make sure they will be prepared for this once they graduate from our university.
As part of the bachelor-studies reform here at the University of Oslo, the Institute of Biosciences, where I work, is reorganising its bachelor curriculum. One exciting part is the implementation of the Computing in Science Education (CSE) project, into the different subjects. The goal of the CSE project is to make calculations/computing an integral part of the bachelor curriculum from the very first semester, interweaving the subject-specific material with mathematics and programming. CSE has been working successfully with the curriculum of the Physics, Mathematics, Informatics, Chemistry and Geology. Starting from the fall of 2017, Biology is next.
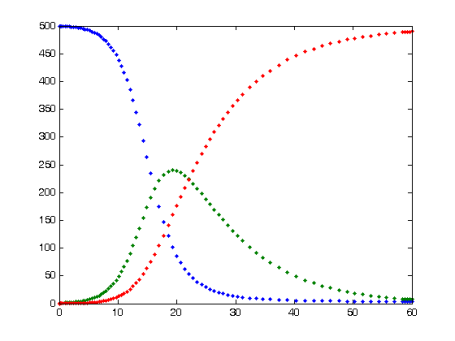
The SIR model for infectious diseases. number of Susceptible (blue=, Infected (green), and Recovered (red), over units of time. From Wikiemedia Commons
The Institute of Biosciences, with the CSE project, set itself an ambitious goal: in the first semester for Biosciences students, one of the three parallel 10-credit courses should be focussing on the CSE aspect. We named the course ‘Introduction to Computational Modelling for the Biosciences”. Four smart PhD students, with backgrounds in physics. informatics and biology, were tasked with writing a book for the course, in which they mix biology with programming in python and modeling of biological phenomena.
The CSE project and the institute have given me the opportunity (and honour) of developing this book, with the authors and the CSE project team, into a full first semester course for Biosciences students. This course (BIOS1100) is starting this fall (August 2017).
Wow. No small task. How to make sure 150 students (perhaps more) become, and then stay, motivated to learn programming in python and developing mathematical models, while what they really signed up for was studying biology! How to make sure the material appears relevant, and is seen as necessary for becoming a biologist? In preparing for teaching the course I have landed on a number of principles I want to adhere to, and ideas that I want to try, to ensure the course will be a success. Some of these are based on experiences obtained from previous courses developed within the CSE framework, as well as on my previous teaching experience. A significant part is based on my experience as a Software Carpentry instructor and instructor-trainer.
Examples and exercises should be using data and questions that the students can relate to, given that they are studying biology/biosciences. As an example, another ‘CSE’ course uses a formula to calculate the time it takes for the centre of the yolk of an egg to reach a certain temperature. The students are asked to implement this formula in python, and calculate the time for the yolk to reach, say 70 C, when the egg is taken from a refrigerator into boiling water. I can still use the same formula, but would place the exercise in the setting of a chicken farmer, that would like to know how long a hen can be away from a fertilised egg before the temperature of the embryo becomes too low.
The two courses the students are taking in the same semester are Cell- and Molecular Biology, and Introduction to Chemistry. I have a very fruitful dialogue with one of the main responsible teachers for the Cell- and Molecular Biology course about ways to integrate what the students learn there, into the Modelling course. We are looking for opportunities to use small python programs to visualise or further analyse data they generate in the lab or are exposed to during the lectures. One of our plans that I am most looking forward to is what we put together for the subject of restriction digestion of DNA. Certain enzymes are able to recognise short DNA sequences and then make a break into the DNA at those sequences. Here is the plan:
My hope is that by exposing students to the subject in multiple ways, on multiple occasions, learning about restriction digestion becomes more effective (and perhaps also more fun). I also am looking into the labwork the students will do in the parallel courses to see whether they generate any datasets that can be further analysed using python or modelling. I suspect that working with data students generate themselves (i.e., have ownership over) enhances motivation and increases learning outcome.
One cannot learn programming from slide-based lectures. Much of the learning will have to be done ‘by doing’, in group work. I will use the Jupyter Notebook, the “killer app” in education according to professor Lorena Barba, in a flipped classroom approach where students study notebooks beforehand (each chapter of the course book can be turned into a notebook), formative assessment is used to gauge understanding, and students work with exercises during ‘class’. We have the fortunate situation that we could design a new classroom to be used for this and others courses. Inspired by a teaching room at the University of Minnesota and this publication we will fill it with hexagonal tables that each have their own large screen for students to share. We will be using a ‘bring-your-own-device’ approach (students working on their own laptops) rather than through Data Labs with stationary, university PCs. This ensures learning can continue on the students own equipment, wherever they are, whenever they want to.
I need to recruit quite number of learning assistants, PhD students and others that work with the students during group work. The aim is one assistant per two hexagonal tables (12 students). How they interact with the students will influence the learning and student experience significantly. I aim to have a couple of small workshops with them before the course starts (using some of the Software and Data Carpentry Instructor Training material for inspiration). During the course we will need to meet weekly to discuss what went well and where we can improve. We will also need to document all this for the next editions of the course.
These weeks, we are trying out some of the material on a small group of current first year bachelor students. This turns out to be very useful, it makes us think about many aspects that otherwise first would have become apparent during the real course. For example, I had first thought to do quite a bit of learning through live-coding, Software Carpentry style. However, I have come to realise that live-coding does not scale: classes will be 50-60 students rather than the typical 20-30 for a Software or Data Carpentry workshop. The chances for delays due to a student getting into a technical problem are much higher, and the number of people affected by the delay much larger. This will cause problems to keep the group’s attention and may become demotivating.
A major challenge will be the motivational aspect, and we should get feedback from the students on this and other aspects frequently. I have lot’s of ideas on what to try to improve the students’ learning and experience but will need to limit myself this year to getting through the course. Finally, the overall aim is not to have this work stop with this one single course. The goal is that all other Biosciences courses incorporate modelling with python, and also R, in group and project-based work. This requires the collaboration of all teachers in the department. At a departmental teaching seminar last year everyone was very enthusiastic. Soon is the time to turn that enthusiasm into concrete projects.
In English:
In Norwegian:
[Adapted from Titus Brown’s blog post]
Titus Brown has been so kind as to invite me to co-instruct this week-long workshop (thanks!). So I thought to make a bit of a commercial for it:
Are you interested in
… then this one-week workshop is for you!
When: June 18-June 25, 2017 (likely we’ll only use Monday-Friday).
Where: University of California, Davis, USA
Instructors: Karen Word, C. Titus Brown, and Lex Nederbragt
This workshop is intended for people interested in teaching, reusing
and repurposing the Software Carpentry, Data Carpentry, or Analyzing High Throughput Sequencing Data materials. We envision this course being most useful to current teaching-intensive faculty, future teachers and trainers, and core facilities that are developing training materials.
Attendees will learn about and gain practice implementing evidence-based teaching practices. Common pitfalls specific to novice-level instruction and bioinformatics in particular will be discussed, along with associated troubleshooting strategies. Content used in prior ANGUS workshops on Analyzing High Throughput Sequencing Data will be used for all practice instruction, and experienced instructors will be on hand to address questions about implementation.
Attendees of this workshop may opt to remain at the following ANGUS two-week workshops so that they can gain hands-on experience in preparing and teaching a lesson.
This week-long training will also serve as Software/Data Carpentry Instructor Training.
Attendees should have significant familiarity with molecular biology and basic experience with the command line.
We anticipate a class size of approximately 25, with 3-6 instructors.
The official course website is here.
Applications will close March 17th.
The course fee will be $350 for this workshop. On campus housing may not be available for this workshop, but if it is, room and board will be approximately $500/wk additional (see venue information). (Alternatives will include local hotels and Airbnb.)
If you have questions, please contact dibsi.training@gmail.com.
You were a pioneer, the first successful ‘next generation’ (if you’ll pardon the term) commercially available sequencing platform in 2005. You just beat Solexa, but it was a fairly close call.
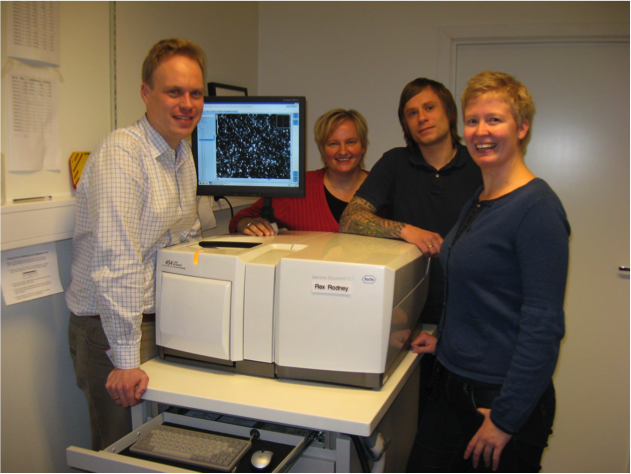
The author (left) with colleagues showing off their 454 GS FLX
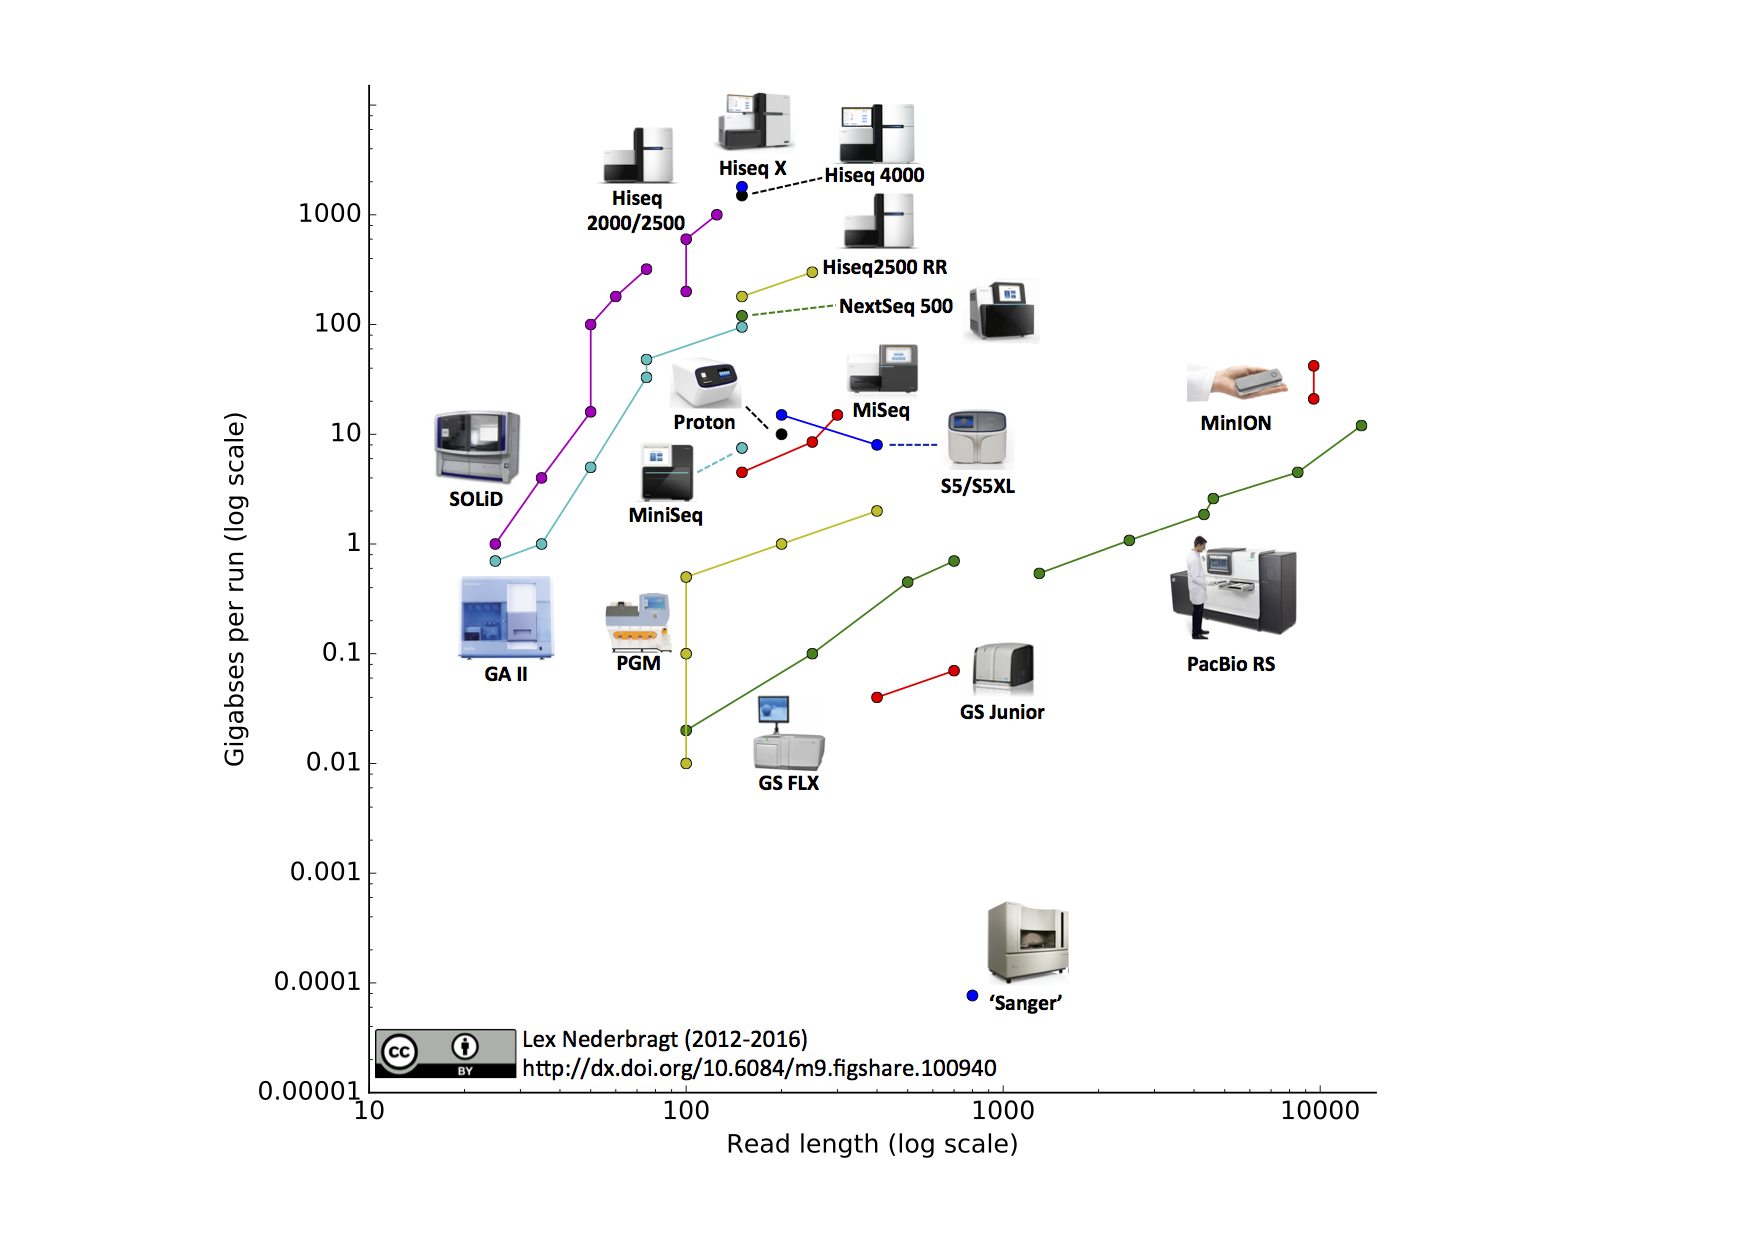
This is the fifth edition of this visualisation, previous editions were in June 2015, June 2014, October2013 and December 2012.
As before, full run throughput in gigabases (billion bases) is plotted against single-end read length for the different sequencing platforms, both on a log scale. Yes, I know a certain new instrument (different from last time) seems to be missing, hang on, I’m coming back to that…
Notable changes from the June 2015 edition
I’m done. No more. From now on, for me it is Open Science, or nothing. I will no longer do closed science.

Source: wikimedia commons, user Jérôme
Fast forward more than 10 years, and science is changing, opening up: Open Access is gaining traction, Open Source software is what I use every day, Open Data is trending. And I am sold, have been for a few years now. Open Science is the best way to guarantee scientific progress, to spread knowledge fast, and to stimulate collaboration and reduce competition. To use the famous quote:
The opposite of ‘open’ isn’t closed. The opposite of open is ‘broken.’ – John Wilbanks
But, opening up for me has been hampered by working in a research environment that is very slow in its uptake of Open Science. The lure of the Impact Factor is still very much present, as is the fear of being scooped by early sharing of data. I can’t really blame any of my colleagues, it has been their way of doing science as long as they can remember. They will stick to this way of pursuing science unless the scientific reward system changes, from its reliance on publications in high Impact factor journals needed for grants, which again are needed for a career, towards recognising the true value and impact of a scientist’s contribution towards advancing knowledge. But for me, it is enough now. I am opening up.
I have been pretty open already, posting my presentations to slideshare, making posters and illustrations available through figshare, putting scripts and teaching material on github, posting my peer review reports to publons and blogging about all of this. But there is still so much of what I do that is hidden, closed, unavailable to interested colleagues and potential collaborators. This ends now. I am going to open fully.
I used to think it was no use taking this step, as I am not an independent scientist, I do not have my own funding or my own lab. Rather, I work together with many others or (co)supervise students on different projects. So I didn’t really feel I ‘owned’ the research, the data or the code being produced, and felt I was not in a position to open it up. I also feared I would close doors by using openness as a criterion for my participation in a project. But I have now realised that it is too much a matter of principle for me, that if I want a career in science, it has to be on my conditions, that is, open. Whatever the consequences.
Others before me have taken this step, and in true reuse-what-is-open spirit, I have made my own version of Erin McKiernan’s Open plegde.
My pledge to be open:
Adapted from McKiernan, Erin (2015): Open pledge.
I will work towards retroactively applying the pledge to current collaborations and papers that are underway, where possible. For new collaborations, being able to adhere to the pledge will be a condition of my participation. New grants proposals I am invited into as collaborator will have to contain clauses that make it clear I can adhere to the pledge while participating in the research upon funding.
I am excited to fully join the Open Science movement, and look forward to what it will bring.
As part of my training to become an instructor-trainer for Software and Data Carpentry, I want to help further develop the material used during instructor training workshops. Greg Wilson, who heads the instructor training, and I, decided to make some videos to demonstrate good and not-so-good practices when teaching workshops. Greg recently released his “example of bad teaching” video focussing on general teaching techniques.
For my contribution, I wanted to demonstrate as many aspects as I could of what I wrote in my “10 tips and tricks for instructing and teaching by means of live coding” post.
So here was the plan:
With help from colleague Tore Oldeide Elgvin (the cameraman) and local UiO Carpentry organisers Anne Fouilloux and Katie Dean (playing the role of learners), we recorded the videos. It took about two hours and a dozen attempts, but it was fun to do. Amazing how difficult it is to not doing your best while teaching…
Here are the videos – watch them before you read on about what they were supposed to show. Note that (part of) the unix shell ‘for-loop’ lesson is what is being taught. It is assumed the instructor has already explained shell variables (when to use the ‘$’ in front and when not).
Many thanks to Tore, Anne and Katie for helping out making these videos!
Part 1:
Part 2:
Part 1:
Part 2:
In March 14-18 2016 we organised the first Carpentry week at the University of Oslo. After a mini-Seminar on Open Data Skills, there was a Software Carpentry workshop, two Data Carpentry workshops and a workshop on Reproducible Science as well as a ‘beta’ Library Carpentry workshop.
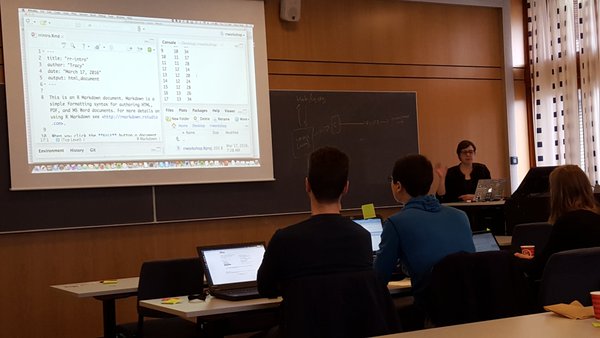
Tracy Teal teaching. Source: https://twitter.com/LeahAWasser/status/710474124162899968
The Software and Data Carpentry effort at the University of Oslo, aka ‘Carpentry@UiO’, really started in 2012 when I invited Software Carpentry to give a workshop at the university. The then director, Greg Wilson, came himself and gave an inspirational workshop – recruiting Karin Lagesen and I to become workshop instructors in the process. Karin and I graduated from instructor training spring 2013 and have been giving a couple of workshops in Oslo and elsewhere.
I was recently asked to provide a testimonial on why I am an instructor for Software Carpentry and Data Carpentry. Here it is:
Teaching in general, and at Software and Data Carpentry workshops in particular, gives me great pleasure and is one of the most personally rewarding activities I engage in. With Software Carpentry, I feel I belong to a community that shares many of the same values I have: openness, tolerance, a focus on quality in teaching to name a few. The instructor training program is the best pedagogical program I know of, and it is amazing to see how Software and Data Carpentry are building a community of educators that are fully grounded in the research on educational practices.
Being an instructor is my way of making a small, but hopefully significant, contribution to improving science, and thus the world.
This testimonial can also be found here.
