
This is the fifth edition of this visualisation, previous editions were in June 2015, June 2014, October2013 and December 2012.
As before, full run throughput in gigabases (billion bases) is plotted against single-end read length for the different sequencing platforms, both on a log scale. Yes, I know a certain new instrument (different from last time) seems to be missing, hang on, I’m coming back to that…
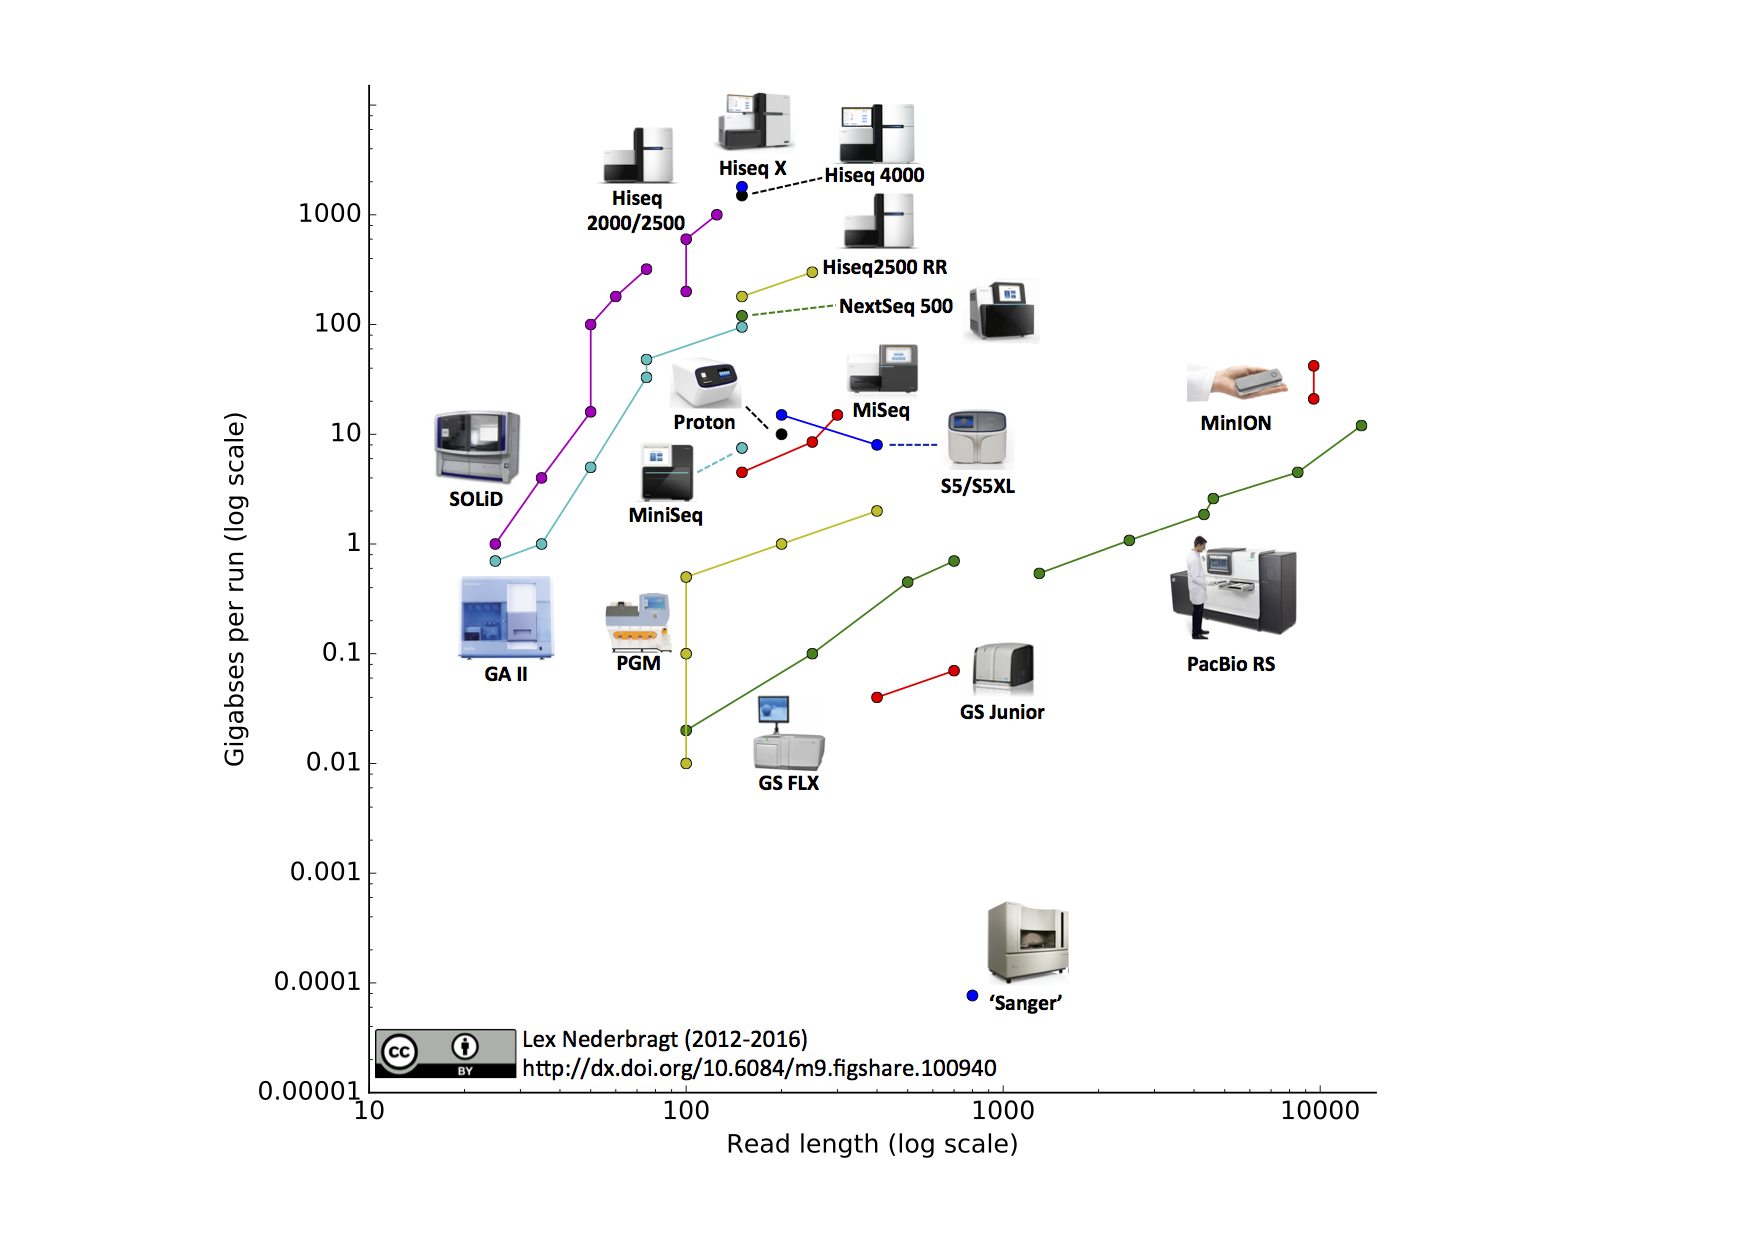
Notable changes from the June 2015 edition
- I added the Illumina MiniSeq
- I added the Oxford Nanopore MinION. The read length for this instrument was based on the specifications for maximal output and number of reads from the company’s website. The two data points represent ‘regular’ and ‘fast’ modes.
- I added the IonTorrent S5 and S5XL. You may notice that the line for this instrument has a downward slope, this is due to the fact that the 400 bp reads are only available on the 520 and 530 chip, but not the higher throughput 540 chip, making the maximum throughput for this read length lower than for the 200 bp reads.
But, where is the PacBio Sequel?
Last year, Pacific Biosciences announced the launch of the Sequel instrument, which according their website “delivers about 7X more reads with 1 million zero-mode waveguides (ZMWs) per SMRT Cell”. However, there are currently no specifications for this instrument on the PacBio website. The brochure about the Sequel System has metrics of a typical run, but these are from data obtained on the PacBio RS II, not the Sequel. I appreciate it is not easy to come up with metrics for this type of sequencing technology, where so much depends on the sample and library types, but I still need them in order to make my visualisation. Thus, until the company adds specifications for their new instrument to their website (or brochures), I reluctantly cannot add it to my visualisation. The next best thing PacBio could do would be releasing some data (and the company has an excellent history of doing so). If these specifications or data appear soon, I’ll update the illustration and this blog post.
Some comments
- look how crowded the 150-300 bp, 1-10 Gbp area of the plot has become…
- I finally switched to using python for generating the ‘bare’ plot (without the images of the instruments), see the Jupyter notebook in the git repo.
- as mentioned in the original blog post: some data was obtained by going to previous versions of company websites through the Internet Archive
- I used full single-run specs with maximally stated throughput as available at the time of writing
- sometimes, the total numbers of reads per full run and total bases obtained do not match up; for the figure, I always chose the reported throughput in bases
- for Illumina, I chose to use the single-end read length, although the maximum throughput was based on the sum of all reads from a paired end run; I felt it unfair to double the read length for this platform for the figure
Availability
Data and figures are released under a CC BY license at figshare, with doi 10.6084/m9.figshare.100940. I’ve also added the content to Github at this repository .
Disclaimer
Data are based on metrics available from instrument providers websites, sources listed in the table can be found here. As before: although I took utmost care in collecting the data, I may have gotten some of my numbers completely wrong, for which I apologise in advance; please help me correct any mistakes or omissions through leaving a comment (or sending me a pull request).
Finally, the raw data
| Platform | Instrument | Label | Year | Reads per run | Read length (mode or average) | Bases per run (gigabases) | Source |
|---|---|---|---|---|---|---|---|
| ABI Sanger | 3730xl | ABI Sanger 3730xl | 2002 | 96 | 800 | 0.0000768 | 0 |
| 454 | GS20 | 454 GS FLX | 2005 | 200000 | 100 | 0.02 | |
| 454 | GS FLX | 454 GS FLX | 2007 | 400000 | 250 | 0.1 | |
| 454 | GS FLX Titanium | 454 GS FLX | 2009 | 1000000 | 500 | 0.45 | |
| 454 | GS FLX+ | 454 GS FLX | 2011 | 1000000 | 700 | 0.7 | 1 |
| 454 | GS Junior | 454 GS Junior | 2010 | 100000 | 400 | 0.04 | 2 |
| 454 | GS Junior+ | 454 GS Junior | 2014 | 100000 | 700 | 0.07 | 16 |
| Illumina (Solexa) | GA | Illumina GA | 2006 | 28000000 | 25 | 0.7 | |
| Illumina | GA | Illumina GA | 2008 | 28000000 | 35 | 1 | 5 |
| Illumina | GA II | Illumina GA | ND | 100000000 | 50 | 5 | |
| Illumina | GAIIx | Illumina GA | 2009 | 440000000 | 75 | 33 | 6 |
| Illumina | GAIIx | Illumina GA | 2011 | 640000000 | 75 | 48 | 7 |
| Illumina | GAIIx | Illumina GA | 2012 | 640000000 | 150 | 95 | 8 |
| Illumina | HiSeq 2000 | Illumina HiSeq 2000/2500 | 2010 | 2000000000 | 100 | 200 | 9 |
| Illumina | HiSeq 2000 | Illumina HiSeq 2000/2500 | 2011 | 3000000000 | 100 | 600 | 10 |
| Illumina | HiSeq 2000/2500 | Illumina HiSeq 2000/2500 | 2014 | 4000000000 | 125 | 1000 | 17 |
| Illumina | HiSeq 2500 RR | Illumina HiSeq 2500 RR | 2012 | 600000000 | 150 | 180 | 13 |
| Illumina | HiSeq 2500 RR | Illumina HiSeq 2500 RR | 2014 | 600000000 | 250 | 300 | 13 |
| Illumina | HiSeq 4000 | Illumina HiSeq 4000 | 2015 | 5000000000 | 150 | 1500 | 19 |
| Illumina | HiSeq X | Illumina HiSeq X | 2014 | 6000000000 | 150 | 1800 | 18 |
| Illumina | NextSeq 500 | Illumina NextSeq 500 | 2014 | 400000000 | 150 | 120 | 14 |
| Illumina | MiSeq | Illumina MiSeq | 2011 | 30000000 | 150 | 4.5 | |
| Illumina | MiSeq | Illumina MiSeq | 2012 | 30000000 | 250 | 8.5 | 11 |
| Illumina | MiSeq | Illumina MiSeq | 2013 | 30000000 | 300 | 15 | 14 |
| Illumina | MiniSeq | Illumina MiniSeq | 2016 | 25000000 | 150 | 7.5 | 20 |
| SOLiD | 1 | SOLiD | 2007 | 40000000 | 25 | 1 | |
| SOLiD | 2 | SOLiD | 2008 | 115000000 | 35 | 4 | |
| SOLiD | 3 | SOLiD | 2009 | 320000000 | 50 | 16 | |
| SOLiD | 4 | SOLiD | 2010 | 2000000000 | 50 | 100 | |
| SOLiD | 5500xl | SOLiD | 2011 | 3000000000 | 60 | 180 | |
| SOLiD | 5500xl W | SOLiD | 2013 | 3000000000 | 75 | 320 | |
| IonTorrent | PGM 314 chip | IonTorrent PGM | 2011 | 100000 | 100 | 0.01 | 3 |
| IonTorrent | PGM 316 chip | IonTorrent PGM | 2011 | 1000000 | 100 | 0.1 | 3 |
| IonTorrent | PGM 318 chip | IonTorrent PGM | 2011 | 5000000 | 100 | 0.5 | 3 |
| IonTorrent | PGM 318 chip | IonTorrent PGM | 2012 | 5000000 | 200 | 1 | 3 |
| IonTorrent | PGM 318 chip V2 | IonTorrent PGM | 2013 | 5000000 | 400 | 2 | 12 |
| IonTorrent | Proton PI | IonTorrent Proton | 2012 | 50000000 | 200 | 10 | 4 |
| IonTorrent | Ion S5/S5XL 530 chip | IonTorrent S5/S5XL | 2015 | 20000000 | 400 | 8 | 21 |
| IonTorrent | Ion S5/S5XL 540 chip | IonTorrent S5/S5XL | 2015 | 75000000 | 200 | 15 | 21 |
| PacBio | RS C1 | PacBio RS | 2011 | 432000 | 1300 | 0.540 | |
| PacBio | RS C2 | PacBio RS | 2012 | 432000 | 2500 | 1.080 | |
| PacBio | RS C2 XL | PacBio RS | 2012 | 432000 | 4300 | 1.858 | |
| PacBio | RS II C2 XL | PacBio RS | 2013 | 564000 | 4600 | 2.594 | 15 |
| PacBio | RS II P5 C3 | PacBio RS | 2014 | 528000 | 8500 | 4.500 | 15 |
| PacBio | RS II P6 C4 | PacBio RS | 2014 | 660000 | 13500 | 12.000 | 15 |
| Oxford Nanopore | MinION Mk1 | Oxford Nanopore MinION Mk1 | 2015 | 2200000 | 9545 | 21 | 22 |
| Oxford Nanopore | MinION Mk1 fast | Oxford Nanopore MinION Mk1 | 2015 | 4400000 | 9545 | 42 | 22 |

Great work Lex…when do expect to add Qiagen’s instrument to the visualisation?
All I can find about the GeneReader is in here http://www.bio-itworld.com/2015/11/9/qiagen-releases-genereader-clinical-sequencing-cancer.html where it says ‘around 100 base pairs’, but also ‘QIAGEN hates talking about the specs. The company line is that most of these metrics are irrelevant to a system that’s only meant to run panel tests, with the analysis and interpretation baked in.’ I couldn’t find specs on the website, nor in the brochure. So, I can’t add it right now. And that is ignoring the fact that it is an targeted-amplicon-only instrument, i.e. perhaps not really comparable with the other instruments in the figure.
Hey Lex, great visualisation plot, good work! 🙂
The only one additional informative thing to see added would be approx. price per sequenced Gb and how also it has changed in time perspective (although complex). Btw. also in June in Nature one review has been published – a 10 years perspective into NGS, which you might find interesting ( http://www.ncbi.nlm.nih.gov/pubmed/27184599 ), especially for comparison of the current SMRT long-reads with Illumina upcoming long-synthetic ones or 10XGenomics.
Thanks for the link – it is on my still-have-to-read list. About pricing, I made a conscious decision not to try to include price information, it is too difficult and too much dependent on local factors (how the sequencing is financed, for example). Others, e.g. the Field guide to NGS, do include prices.
Greatly appreciate the publicly available figure, which I’ll incorporate (with attribution!) into one of my lectures. Look forward to the next update, now that there are reports (at least on twitter) of reads around a million bases long on the MinION (my lab has easily got reads in the >100K range).
Lex,
We are eagerly waiting for the next update. Hope you will manage sometime to update this highly cited plot.
–NB
Dear Lex,
Great blog and very topical. I am using your plot (with reference to this blog) in my classes! Thanks for doing all the hard work!
I am too waiting for the next update, perhaps with NovaSeq6000, GridION, PromethION, …
And maybe the SmidgION will finally arrive.
That said, the Nanopore technologies have very little use in my molecular ecology studies, but they are nice to play with!
-Eero J. Vesterinen
Pingback: High Throughput NGS Systems: TP, Time and Cost Graphic - Silent Valley Consulting | Life Science Technical Writing | Strategy | Marketing