
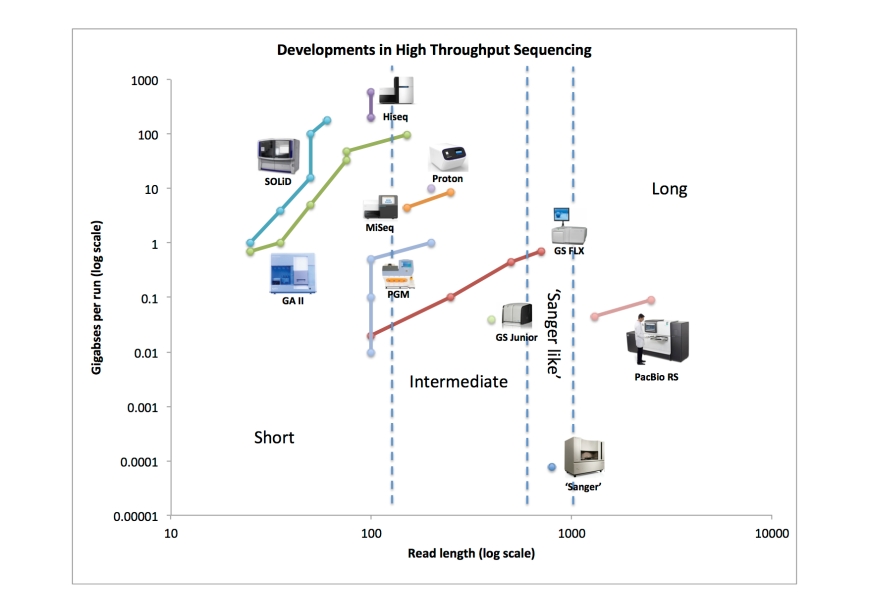
With this post I present a figure I’ve been working on for a while now. With it, I try to summarise the developments in (next generation) sequencing, or at least a few aspects of it. I’ve been digging around the internet to find the throughput metrics for the different platforms since their first instrument version came out. I’ve summarised my findings in the table at the end of this post. Then, I visualised the results by plotting throughput in raw bases versus read length in the graph below.

Developments in next generation sequencing. http://dx.doi.org/10.6084/m9.figshare.100940
I think this visualisation nicely summarises what has happened over the past 7 years, since the GS 20 from 454 came on the market in 2005. For example, one could look at the results like this:
Developments in next generation sequencing – annotated
The cutoffs between the different classes are purely subjective. But they do show that the ‘intermediate’ class is there the fiercest competition is happening, at least between Illumina (MiSeq) and Life Technologies (Ion PGM and Proton).
Some remarks:
- although I took utmost care in collecting the data, I may have gotten some of my numbers completely wrong, for which I apologize in advance; please help me correct any mistakes or omissions through leaving a comment
- some data was obtained by going to previous versions of company websites through the Internet Archive
- I used full single-run specs with maximally stated throughput whenever appropriate
- sometimes, the total numbers of reads per full run and total bases obtained do not match up; for the figure, I always chose the reported throughput in bases
- for Illumina, I chose to use the single-end read length, although the maximum throughput was based on the sum of all reads from a paired end run; I felt it unfair to double the read length for this platform for the figure
- the 300 bp kits from Ion Torrent for the PGM are not taken into account here, as these are not listed under the specs for this platform at the time of writing
- Pacific Biosciences does not seem to report per-SMRTCell metrics on their website, so I used the throughput specs as we have been told them by the company instead; this means that the announced upgrade (C2 XL, average read length 4.3 Kbp) has not yet been taken into account
- although some users report running the HiSeq at 2 x 150 bp, this is not supported (listed) on the Illumina website, so I stuck with 100 bp
- ‘HiSeq’ stands for both HiSeq 2000 and HiSeq 2500, as according to the Illumina website, these instruments give the same maximal throughput
- the figure was mashed together using MS Excel and Powerpoint – for my lack of a being able to use a program that does a nicer job; if you want to help me out giving the figure a more professional look, let me know!
Figshare
I’ve ‘published’ the table and figure at figshare, which means it is citeable and gets a DOI: http://dx.doi.org/10.6084/m9.figshare.100940 (CC-BY license, data CC0 license).
Table
Here is the ‘raw’ data – please help me improve the table through the comments section.

EDIT: the table was reproduced ‘in a web-friendly tabular form’ on the next gen seek blog.

This is old, but the authors seem to have a website with updated info – http://www.homolog.us/blogs/2012/08/24/a-great-review-of-various-sequencing-instrumentstechnologies/
I recently put together the following estimates of dates/outputs for Illumina’s instruments. They differ a bit from what you have, but they’re pretty accurate. They might be biased towards “best field results” rather than “typical field results”, but they do represent real-world results.
1/1/07 Solexa 1G 1
6/1/07 GA 5 (rough date estimate and output estimate)
6/1/08 GAII 30 (rough date estimate)
5/6/09 GAIIx 50
1/1/10 GAIIx 95 (rough date estimate)
4/10/10 HiSeq 2000 200
6/1/11 HiSeq 2000 600
Thanks. I’ll look into merging your data with mine as soon as I have a bit of spare time…
Hi, very interesting summary can I use your image for a presentation, citing you as source?
That’s the idea! There is a DOI you can cite, see the post, or cite this post. Good luck!
Already needs some updating…
Ion PGM is capable of 300bp runs; 400bp next month. We’ve done 2×300 paired end in house – works great after a little troubleshooting. As soon as we get our OneTouch upgraded to do 400bp runs, we’ll likely shoot for 2x400bp runs as well.
But otherwise… nice InfoGraphic. Thanks!
You’re welcome. I was strict where possible: the company website should list the read length, and http://www.invitrogen.com/site/us/en/home/Products-and-Services/Applications/Sequencing/Semiconductor-Sequencing/pgm/specifications.html does not list 300 bp (although the kits are listed elsewhere). But, the next version of the graph will most likely have the 300 bp read length added for Ion.
Your Illumina HiSeq 2011 row numbers seem a bit off. You quote 3 billion reads per run with 100bp reads and then come up with 600Gbp output. I think you’ve muddled numbers for a single flow cell and dual flow cell.
According to the Illumina specs for HiSeq a single flow cell produces up to 3 billion paired-end reads and 270-300Gbp of data. For the dual flow cell, it generates up to 6 billion paired-end reads and 540-600Gbp of data.
You’re right, thanks! I will correct this at the first occasion…